Stay Ahead of Sick Leave —
Smarter Facility Decisions
with Qwota
Qwota is a proactive environment monitoring dashboard built for facilities teams.
It helps you identify hidden vulnerabilities such as seasonal temperature shifts or air quality changes
that contribute to spikes in sick leave. With Qwota, your team can stay ahead of
absenteeism, reduce budget losses, and ensure healthier, more productive workspaces.
It’s not just data — it’s actionable foresights
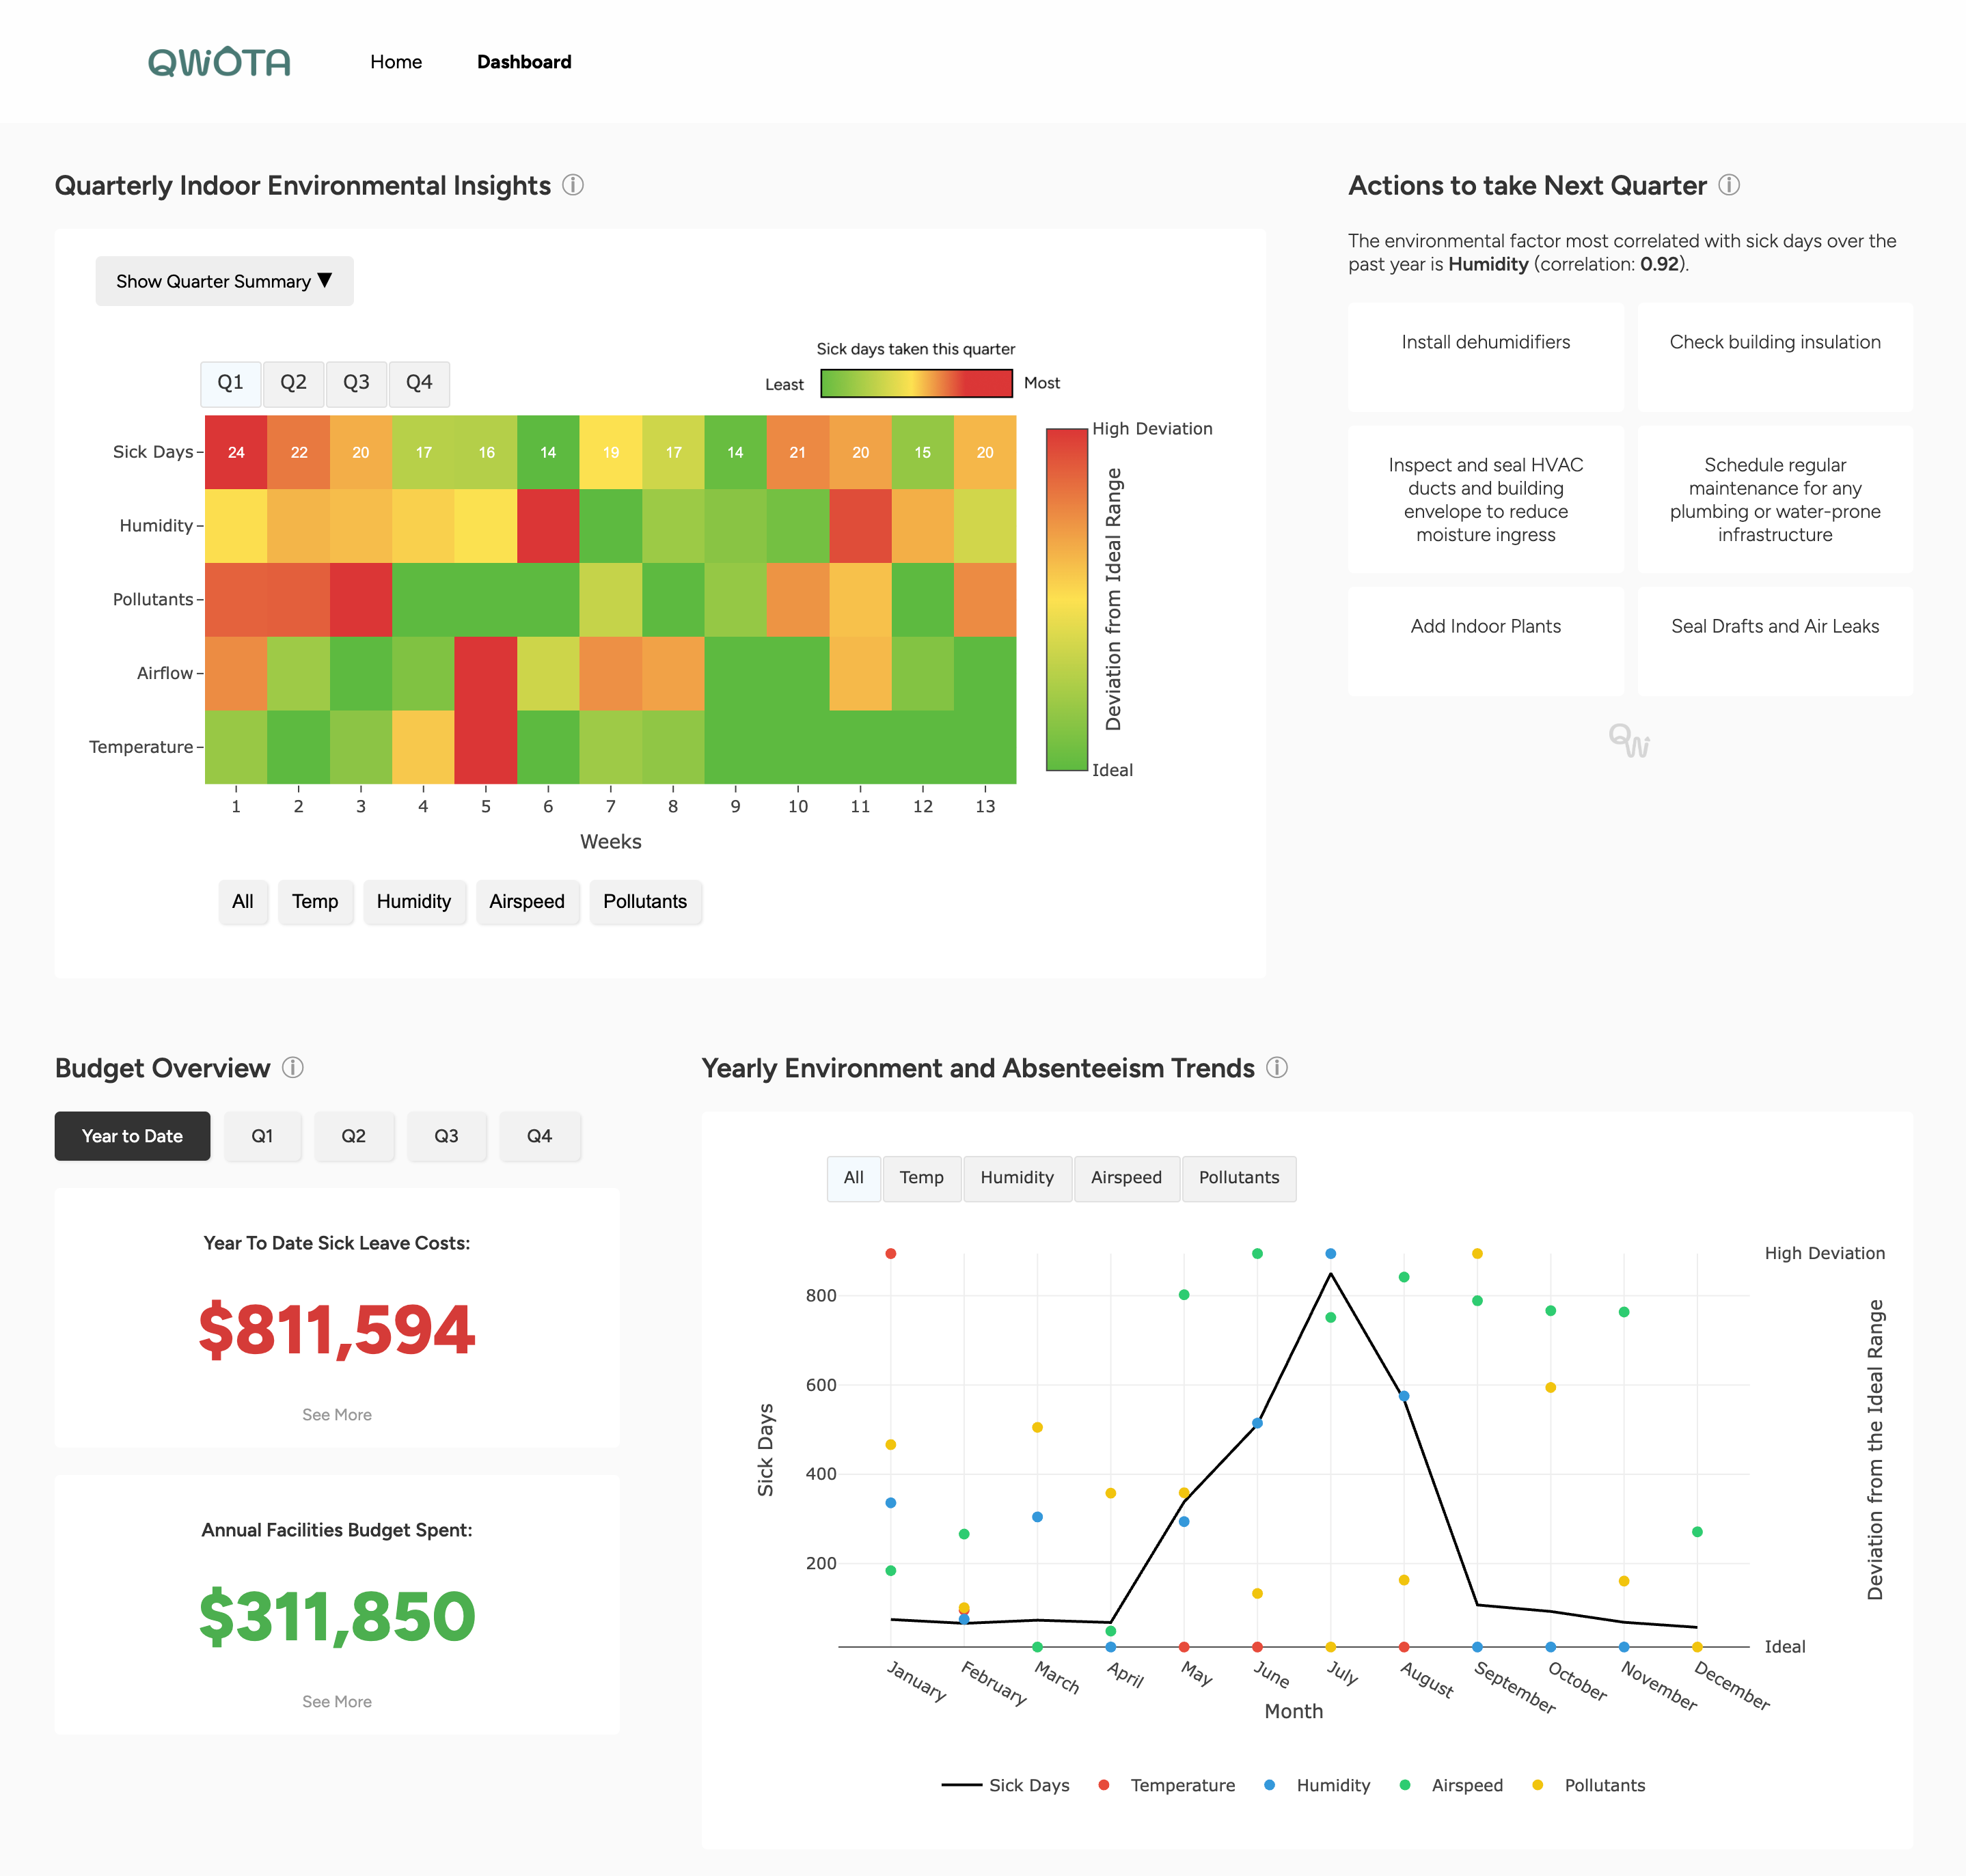
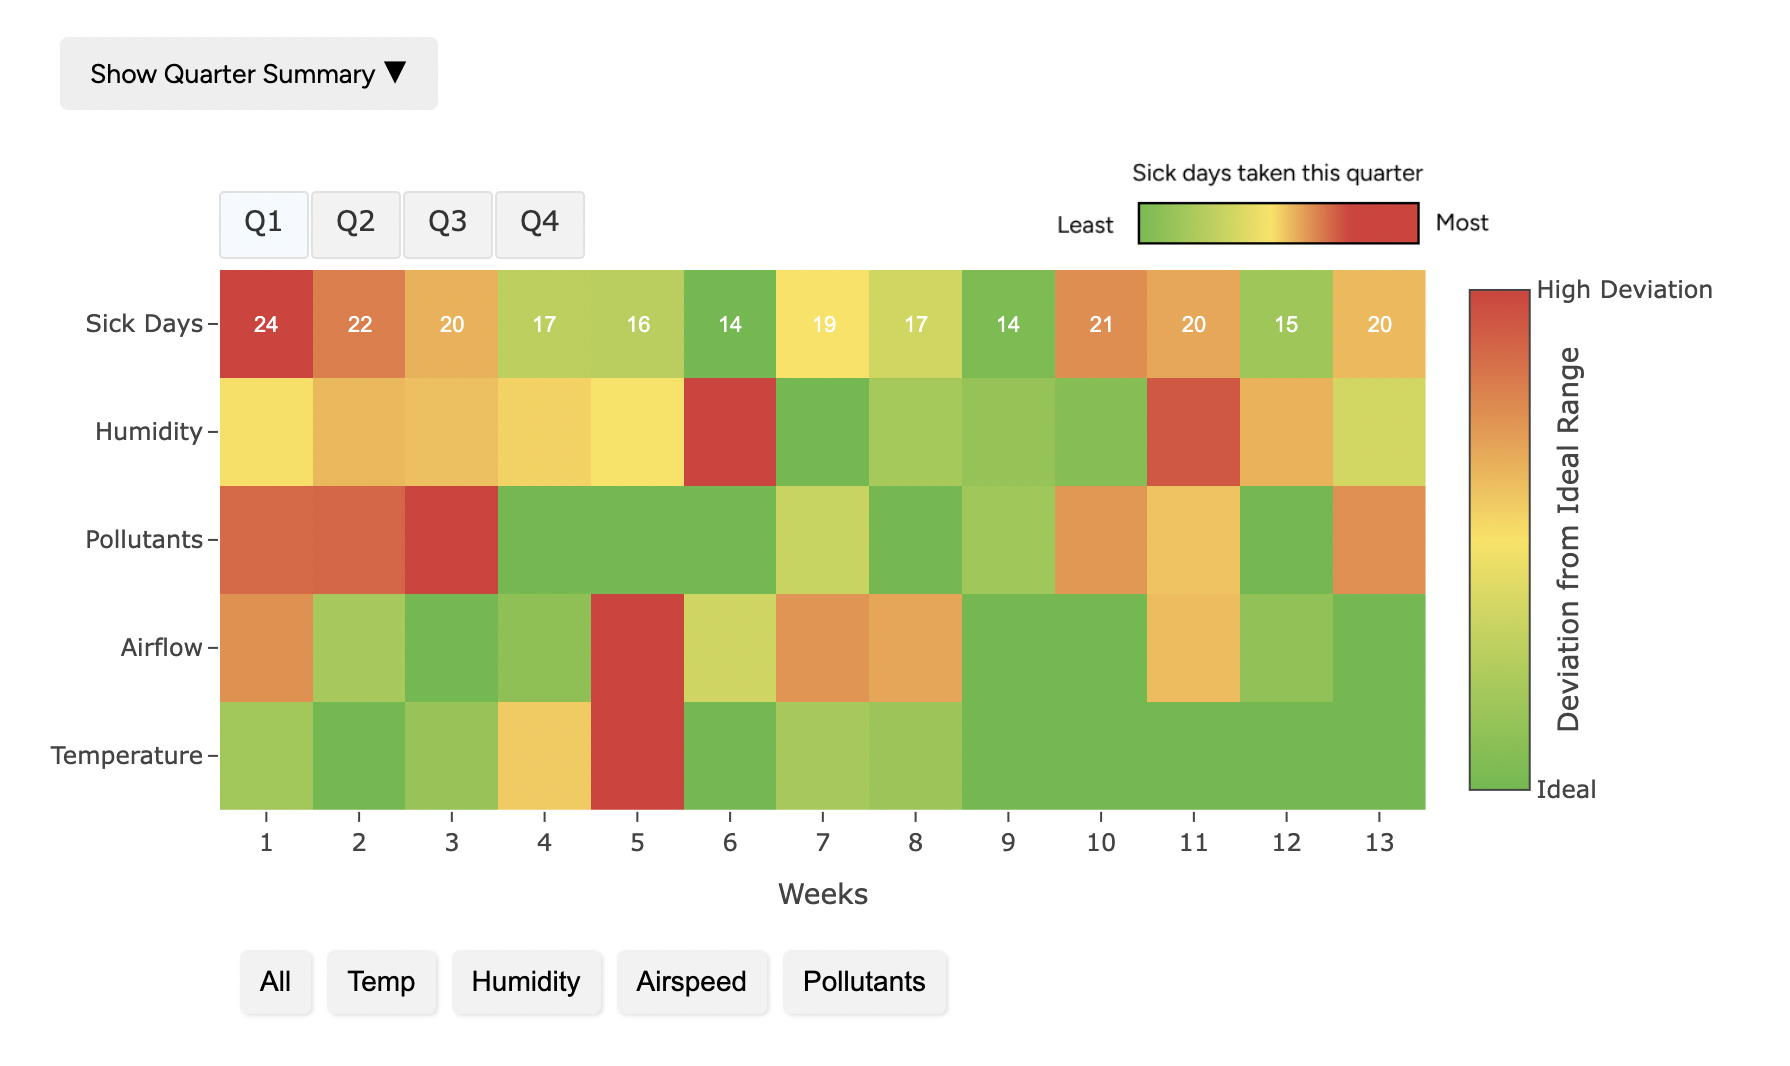
The Quarterly Monitor
This heat map helps the facilities manager analyse the office’s IEQ on a week by week basis over each
quarter which helps them understand the performance of directed projects and also prioritise different
targets according to the data.
!
Cicking this buttons opens up a summary of the quarter's most deviated factor and weeks with highest variations.
!
This heatmap shows how IEQ varies weekly in each quarter.
!
These buttons allows you to view a more detailed graph of each
environmental factor.
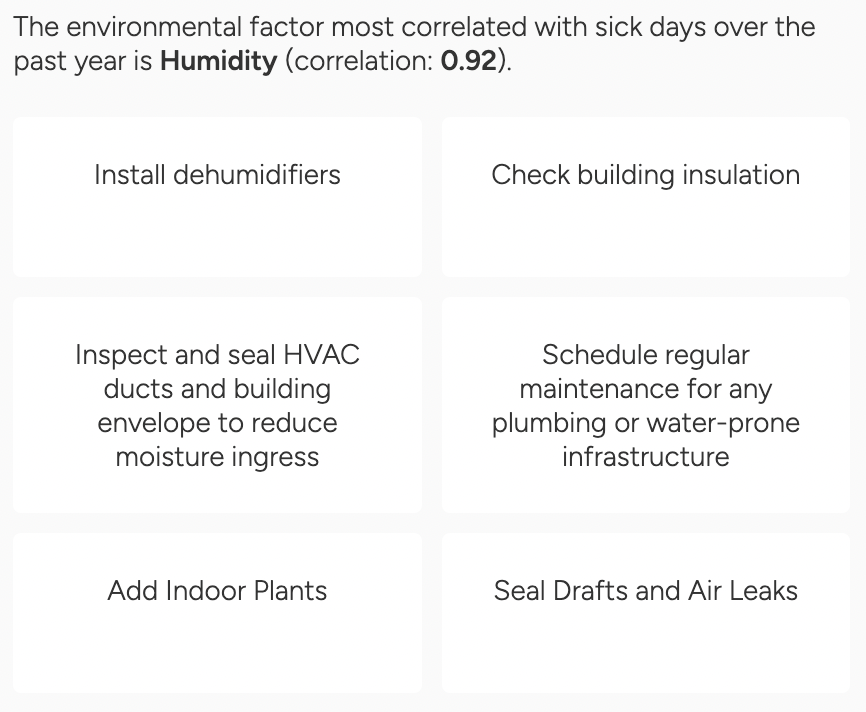
The Action Panel
This offers the facilities manager some suggestions on actions to take during the quarter that directly
addresses the factors of high variances from the healthy ranges in the data, allowing them to spend the
budget in areas that make the most impact.
!
This shows the factor most correlated with sick days.
!
You can mark off actions as complete once implemented by clicking the card.
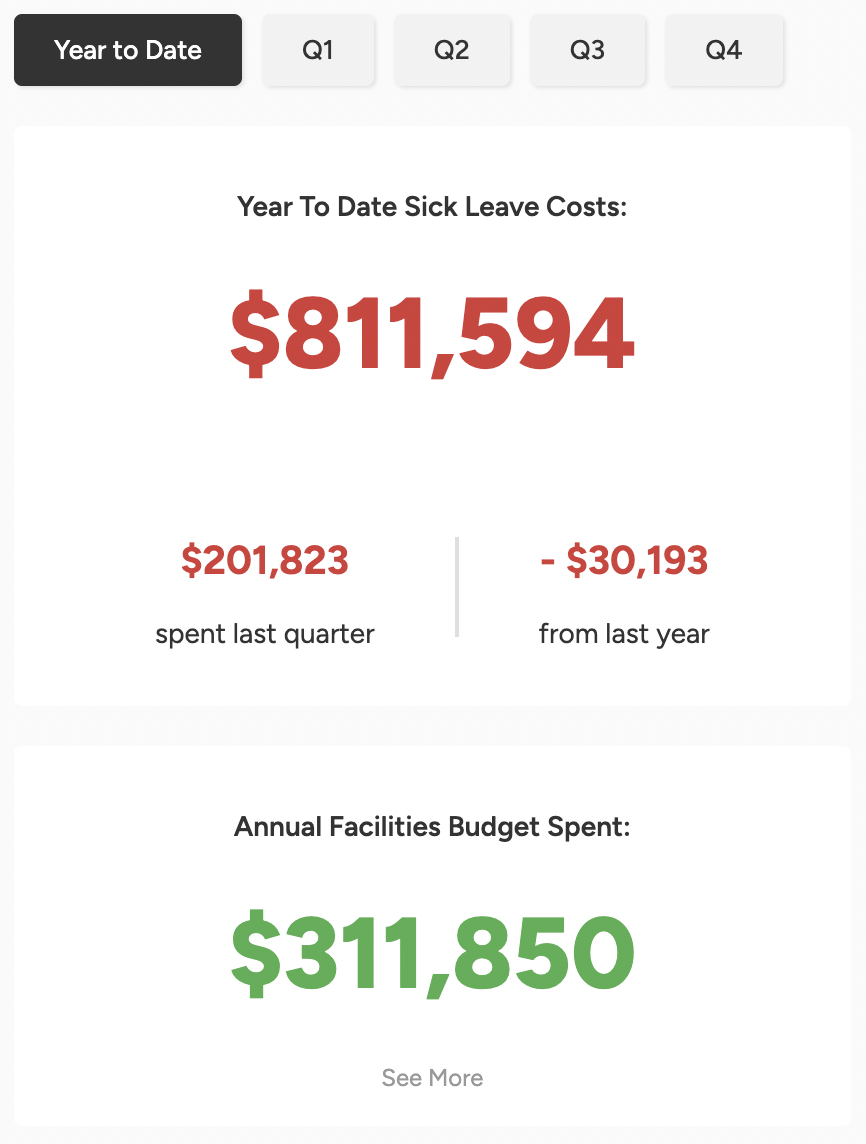
The Budget Monitor
This indicator show the current state of money spent on sick leave and the facilities management budget
spent to provide a visual comparison on the positive or negative changes from the previous year.
!
Hovering over the budget cards expands them to show more detailed
metrics.
!
These buttons allow you to have a closer look at each quarter's budget overview.
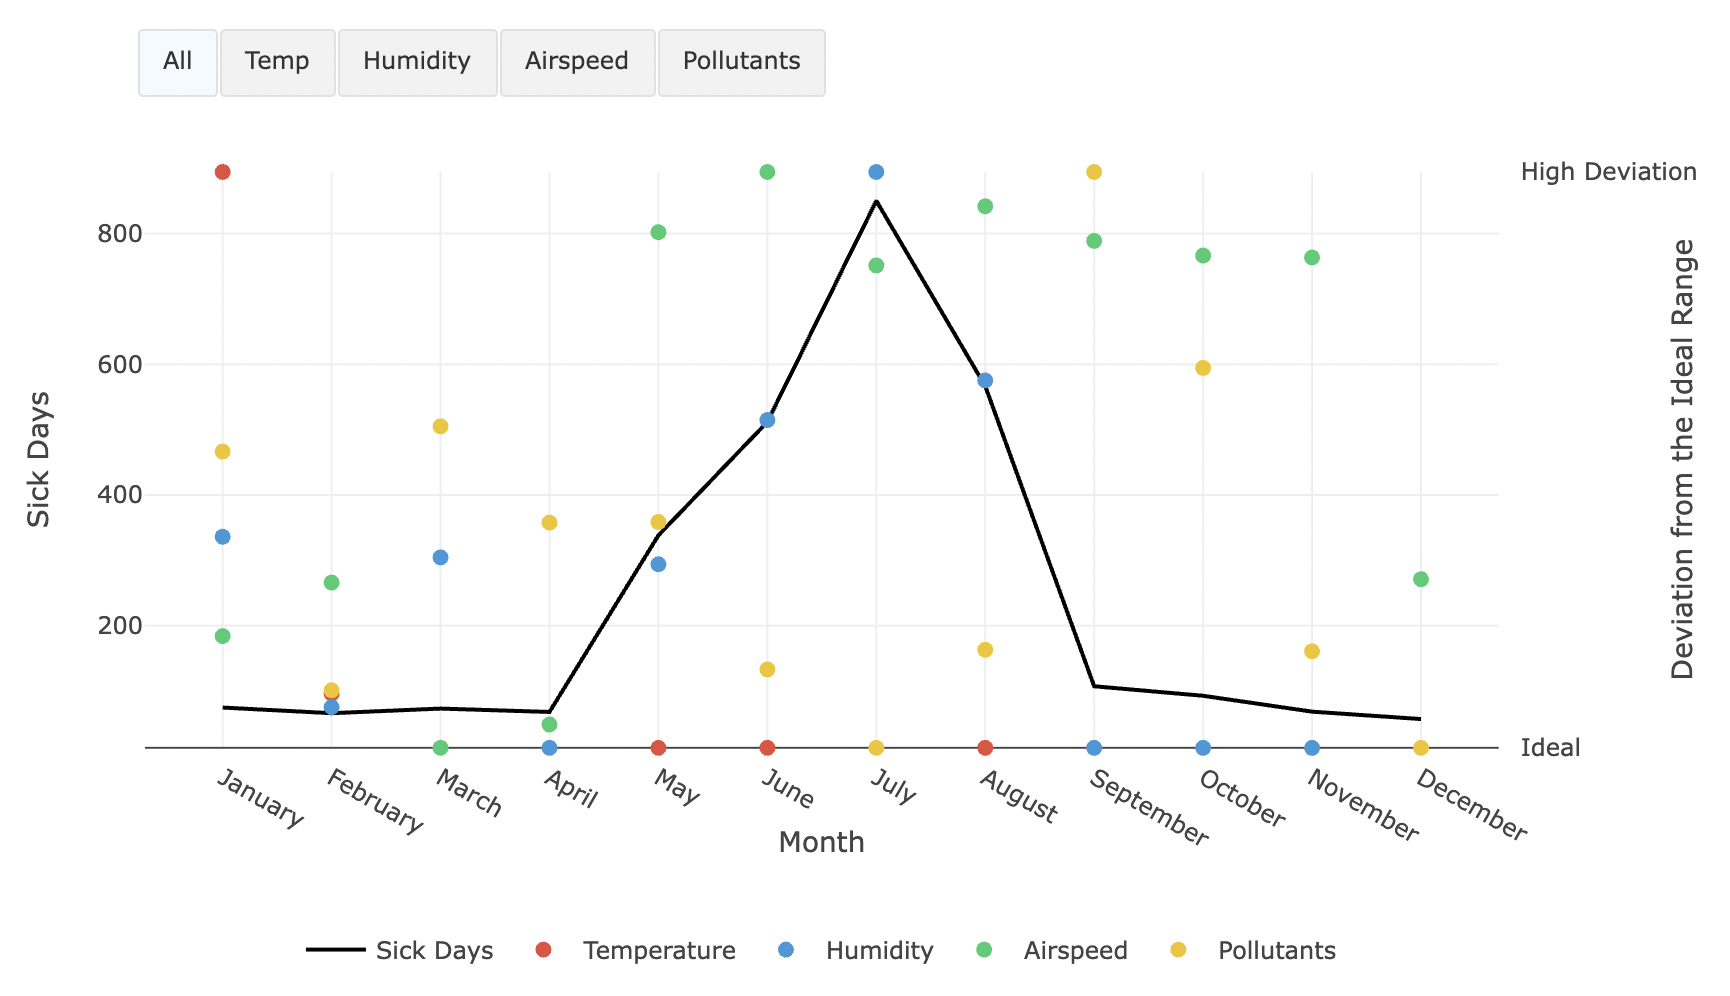
The Yearly Monitor
This graph shows the facilities manager the relationship between each IEQ factor and the rate of sick
leave taken, helping them develop long term solutions and forecast future projects to relieve the cost
on employee absenteeism and optimise the facilities management budget.
!
These buttons allows you to filter through each environmental
factor.